Investing in our environmental and cultural heritage
Carbon footprint of MCB Ltd7
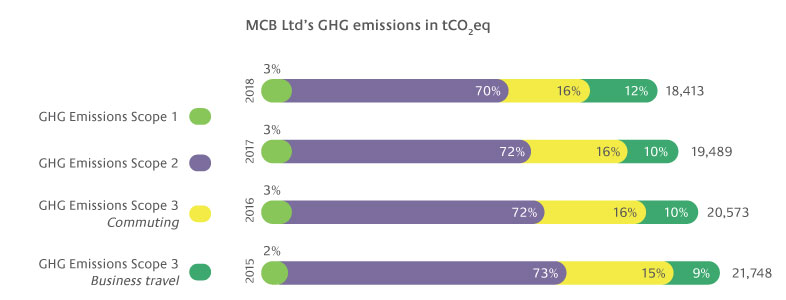
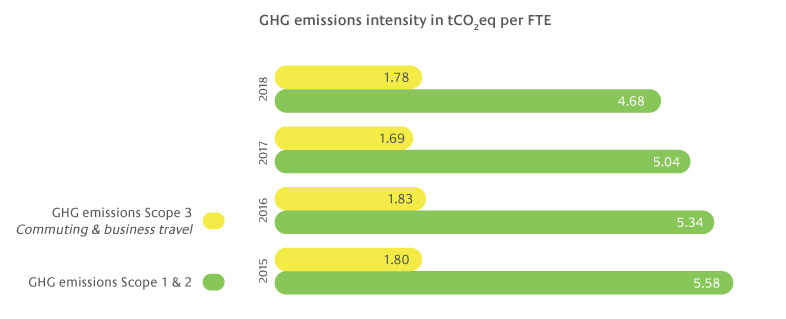
MCB’s Carbon footprint analysis in 2018 follows the GHG Protocol8. This approach identifies direct and indirect emissions sources related to MCB Ltd’s activities:
- Direct GHG emissions: from sources that are owned or controlled by the Bank.
- Indirect GHG emissions: are a consequence of the activities of the Bank, but occur at sources owned or controlled by another entity.
The GHG Protocol categorises GHG emissions caused by an organisation into three broad scopes. In accordance with this categorisation and considering the consolidation approach selected by MCB Ltd (control approach), our carbon footprint analysis is broken down into Scope 1 & 2 emissions. Additional Scope 3 emissions related to employee commuting and business travel are also included. This year, the Bank has extended its carbon footprint analysis to account for an estimation of the carbon emissions associated to its loan products i.e. Scope 3 – ‘Use of products’ category.
7 KPIs reported in this section relate to our banking operations in Mauritius only and cover the reporting period January to December 2018
8The Greenhouse Gas (GHG) Protocol, developed by World Resources Institute (WRI) and World Business Council on Sustainable Development (WBCSD), sets the global standard on how to measure, manage, and report greenhouse gas emissions. This standard is used by a diverse range of organisations, including many in the banking sector, and is widely accepted as best practice.
MCB Ltd GOAL: Be Carbon neutral by 2023 (Operations & Upstream supply chain)


© 2019 MCB GROUP #Success Beyond Numbers

